

You may have a strong understanding of how to smoothly run your business and ‘wow’ customers – but the big question is, are you actually making any money? Are you doing it all for the love of it, or do your #lifegoals actually involve reaching the big pot of gold under the rainbow for all your efforts?
You see being a really good service provider on its own isn’t enough. The long-term success of your business is really going to depend on your understanding of the key business metrics and ratios that drive your business profitability so you can make good money.
Have you heard the saying ‘You can’t manage what you don’t measure?’ (Thanks Peter Drucker!). Well, if you are ready to move on from using your gut instinct with your numbers, or the game of flying by the seat of your pants to make money, read on.

What is a KPI and a ratio?
So, let’s start with…. What even is a KPI or a ratio? What the..?
Financial information about your business can be used to develop a set of measurements that allow you to better monitor both your current position and your progress. These measurements are called business ratios or key performance indicators (KPIs). A ratio is nothing more than a number in relation to another.
There are countless ratios and kpis that can be calculated. The key for you to determine which ratios are the appropriate ones to use to analyse your particular business and its ongoing performance.
We recommend selecting a set of ratios (possibly 3 – 5) which communicate to you how your business is operating, and then stick with these ratios over time to spot trends, strengths and weaknesses and areas of opportunity.
No one individual ratio tells the whole story. However, when you look at them together you’ll have a much clearer picture of what you need to do to steer your business in the right direction.
Below we’ve listed out 5 of the most popular KPI’s most savvy business owners should be across.
The 5 KPIs the savvy business owner needs to nail
1. REVENUE GROWTH
Are your sales going up or down over time?
They say that if you aren’t moving forwards you are going backwards (Mikhail Gorbachev). While revenue growth doesn’t automatically equate to an increase in profit or making money for that matter, it is a good key metric to keep track of.
How do you calculate revenue growth?
- Track sales (and compile income reports with your accounting software) from one period to the next
- Subtract the previous period’s revenue from the current period
- Divide that number by the total of last period’s revenue
And voila! You’ll get revenue growth expressed as a percentage. The aim of the game is to have positive growth. Negative growth tells you something is wrong and that you need to take corrective action.
 Pro Tip: Income sources
Are you tracking where your income is coming from? For example, if you are a tree lopper you may separate your sales on your profit and loss report into buckets – such as residential tree lopping and commercial tree lopping so you can start to see what is making up your income. The same goes, for a café, you may break your sales into food, drinks and catering so you can really start to see what is driving your sales. This needs to be set up in your Chart of Accounts in your accounting software so you can break your sales into the particular categories.
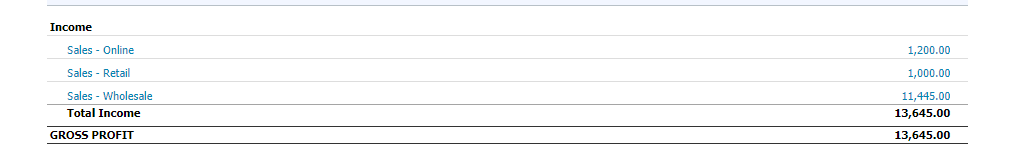
2. GROSS PROFIT MARGIN
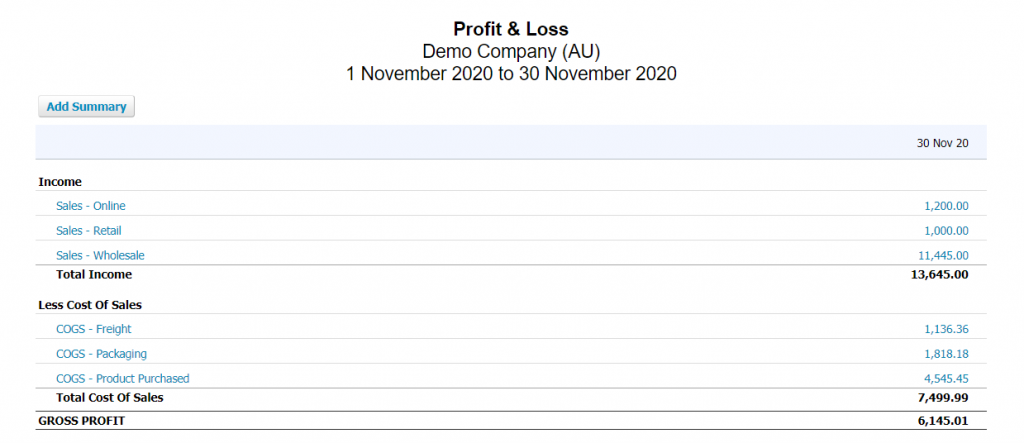
Your gross profit margin is how much of your income is profit after taking into account the direct costs associated with producing that product or service.
Direct costs (aka Cost of Goods Sold – COGS) could be things such as what it cost you to purchase the widget that you are selling, the cost of freight, packaging and any direct production wages.
Expenses that are not cost of goods sold would be your telephone bill and electricity as the cost of these things doesn’t really change in direct proportion to the amount you sell. These are often known as overheads.
COGS can be harder to identify in a service-based business, but for example a training consulting firm, may include the direct staff cost to provide the service and any room hire, travel or technology costs required to deliver the training consultation.
Other names you may hear thrown around for COGS would be direct costs or material costs or cost of sales.
How to calculate your gross profit margin:
(Revenue – Cost of Goods Sold) / Revenue = Gross Profit Margin.
This is a percentage. There are common benchmarks for different industries to generally know where your gross profit margin needs to sit to run a profitable business. Some industries it could be as low as 10% while others may sit at 50% or higher.
Your gross profit margin needs to be high enough to cover your operating expenses and leave you a profit at the end of the day.
Tracking your gross profit margin over time will enable to see if you are improving. For example, are you buying your stock at lower prices to increase your gross profit margin? Or are you increasing production staff efficiencies to produce more for the same price? Conversely, if your gross profit margin is starting to drop, you need to ask questions and work out why.
You want your gross profit margin increasing so that you are making more in every dollar that you sell.
Pro Tip: Chart of Account and Report set up
Make sure you have set up your Chart of Accounts with your COGS accounts classified as Direct Costs correctly so that when you run your Profit and Loss, you can see and calculate your Gross Profit Margin quickly and easily.
3. BREAK EVEN POSITION
This is the point where revenue exactly covers expenses. This is how much you need to sell each day or week to keep the doors open. So how much do you need to sell exactly to break even?
Step 1: Classify your expenses into two cost categories: fixed or variable. Then add up the total for each category. Fixed costs remain constant no matter how much you sell (ie electricity, rent), whereas, variable costs increase in proportion with the amount you sell (ie packaging, freight).
If you can’t decide or are unsure how to classify a particular expense, be conservative and classify it as fixed. This will make your break – even point higher.
Step 2: Now, determine the Variable Cost percentage. That is the total variable expense as a percentage of sales.
Variable Cost / Sales = Variable Cost Percentage
Step 3: Determine the contribution margin. That is the amount from each sales dollar which is left after deducting variable costs – to cover fixed costs:
Sales % – Variable Cost % = Contribution Margin %
This is also the same thing as:
100% – Variable Cost % = Contribution Margin %
Step 4: Calculate break even.
In Dollars:
Break Even = Fixed Costs / Contribution Margin %
Let’s work through an example to make sure you are on the right track.

Example: Peter’s Painting Services
Income for 2019/20 = $650,000
Details of expenses for 2019/20:
Variable Costs = $500,000
Fixed Costs = $200,000
What was the break-even sales point for Peter’s Painting Services in 2019/20?
Variable Cost % = 76%
Contribution Margin = 24%
Break Even Sales = $833,333
4. WAGES AS A PERCENTAGE OF SALES
Wages can be the major expense for many – or most – businesses and therefore, wages as a percentage of sales is a common key business metric. This ratio measures the cost of employees in relation to sales and enables you to identify problems and opportunities to capture payroll savings.
Knowing your wages as a percentage of sales, is probably the most common KPI after gross profit margin. It can also enable you to track how efficiently your workforce is performing for your business.
How to calculate it:
Wages costs to sales = Employee Costs / Sales
Decreasing your wages cost as a percentage of sales over time can be a key driver to improving profitability. For example, did your team pack twice as many sales orders in the same time this week compared with last – or did your café wait staff look after less patrons than last month for the same cost?
Each industry generally has wage cost benchmarks, so it is a good idea to get familiar with yours. The ATO also has small business benchmark information available here.
Pro Tip:
It would also be worthwhile to run this formula to calculate your other major expenses as a percentage of sales, such as rent, motor vehicle expenses and more. This will give you a good understanding of what makes up your major expenses. A small change in one of these expenses can have a big impact on your profitability. What is driving your expenses?
5. ACCOUNTS RECEIVABLE & ACCOUNTS RECEIVABLE TURNOVER
Your accounts receivable turnover ratio measures how well you collect cash from your customers. Accounts receivable, in layman’s terms, are accounts you are expecting to ‘receive’ – payments you are expecting from customers.
Fundamentally, you are doing what you do to get paid, right? So, collecting payment from your customers is pretty integral to the whole show.
You need to be able to see who owes you what at any given time. An up-to-date accounts receivable report will show this to you to enable you to take action as needed.
If your accounts receivable figure, the amount of money customers owe you, is increasing – you are making sales but not getting paid for them, and shortly you may run out of cash as a result.
Your accounting software package will enable you to run an accounts receivable report. This needs to be done once all of your sales are entered, bank accounts and payment services are reconciled!
Meanwhile, accounts receivable turnover is the ratio that measures the rate at which accounts receivable are being collected on an annual basis. For example, an accounts receivable ratio of 8.00 means that the average dollar volume of accounts receivable are collected 8 times during the year.
The higher the ratio for accounts receivable turnover, the better it is because it shows you your customers are paying you faster.
The formula is:
Accounts receivable turnover = Sales / Accounts Receivable
If you want to work out how long on average it is taking people to pay you, you can calculate the average collection period as follows:
Average collection period = 365 / Accounts receivable turnover
This converts the Accounts Receivable Turnover ratio into the average number of days the company must wait to be paid. For example, an Accounts Receivable Turnover Ratio of 45 means that it takes the company 45 days on average to be paid.
How are your results sitting in relation to the trading terms you offer your clients?
Pro tip: Accounts receivable report
Monitor your accounts receivable report each week to check for late payers and outstanding invoices. This report is particularly helpful if you have cash flow problems as it identifies where you can seek payment from and improve your accounts receivable turnover.
Where to begin…
While the metrics above are a great starting point, there are many KPI’s that can inform your strategy moving forward and assist you to best pinpoint areas in your business that may need improvement. In order to decide where to begin with your specific business the best place to start would be to talk to other people within your industry, your financial advisor, accountant or bookkeeper to find out what you should be tracking for your business.
However, at the core of it all it really is a MUST to have up to date accounts in an online accounting software program to give you the power of information with regularity, both quickly and efficiently. Because, there’s not a great deal you can do about it if you find out 6 months down the track that your gross profit margin was waaaayyyy too low. Think of all the time, money and effort you’ll have lost.

How we can help you
Here at Diverse, we deliver better systems and numbers you can trust so you can grow your business. We provide expert Xero bookkeeping, training and support services.
If you’d like to apply for a free 30-minute Xero audit call with us to chat about what is causing you grief about your current accounts systems so that you can have up to date KPI data about your business –
We’re all ears.